
How to use the platform
How can I access the indicators?
- Built environment
- Socio-economic
- Environment
- Mobility and transport
- Gender
- Territorial safety
- Well government and citizenship
Consulting the indicators is very easy. To do it, you can reach the indicators panel located on the left side of the site. This panel has seven buttons, one for each thematic group. Upon clicking one of them, a menu is displayed, which contains the indicators set pertaining to that category. For example, the following image illustrates what happens after clicking the icon for “Built environment”:
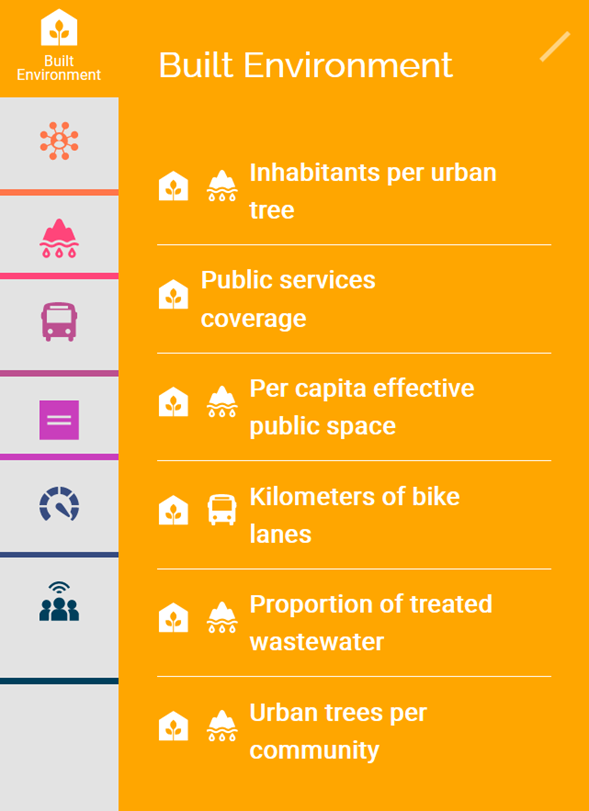
Indicators panel
When the menu appears you can click on any of the names that it displays. Thus, the information of each indicator is at a two-click distance. Moreover, the icons before the indicator’s name point to the theme or themes that the indicator belongs to.
Once on the indicator page, the site allows the visualization of the data according to the indicator’s content. In this example, we can see a graph of the variation in time of the number of inhabitants per tree in the urban area of Pereira. The different visualization types can be consulted in “Available visualization types”

Indicator page

Tabs on the indicator page
Finally, for the case of indicators with bar charts, pie charts, and maps, it is possible to select the year for the visualization’s information. This is possible by selecting the ‘Select year range’ tab, located on the upper-right side of the site, as illustrated by the following image:

‘Year rage’ selector
Which type of visualizations are available on this site?
During this tutorial, we have exposed some types of graphs available on the platform. For example, the pie chart on the former title. Nonetheless, this title aims to enumerate and explain the different available graphs on Pereira Sustainable Territory. These are:
- Pie charts
- Line charts
- Bar charts
- Maps
Also, it is important to have in mind that when you hover the mouse over the graphs they display an information bubble with the name of the category and the indicator’s value.
The following is an overview of each of the graph types available:
Pie chart
Pie charts represent the fraction that each subset contributes to the total. For example, the next pie chart illustrates the number of deaths that each vehicle contributes to the total deaths related to traffic accidents. Furthermore, this graph type allows visualizing the indicator for each year on the dataset. Doing it is as easy as selecting the year on the selector tab located on the right side of the graph.
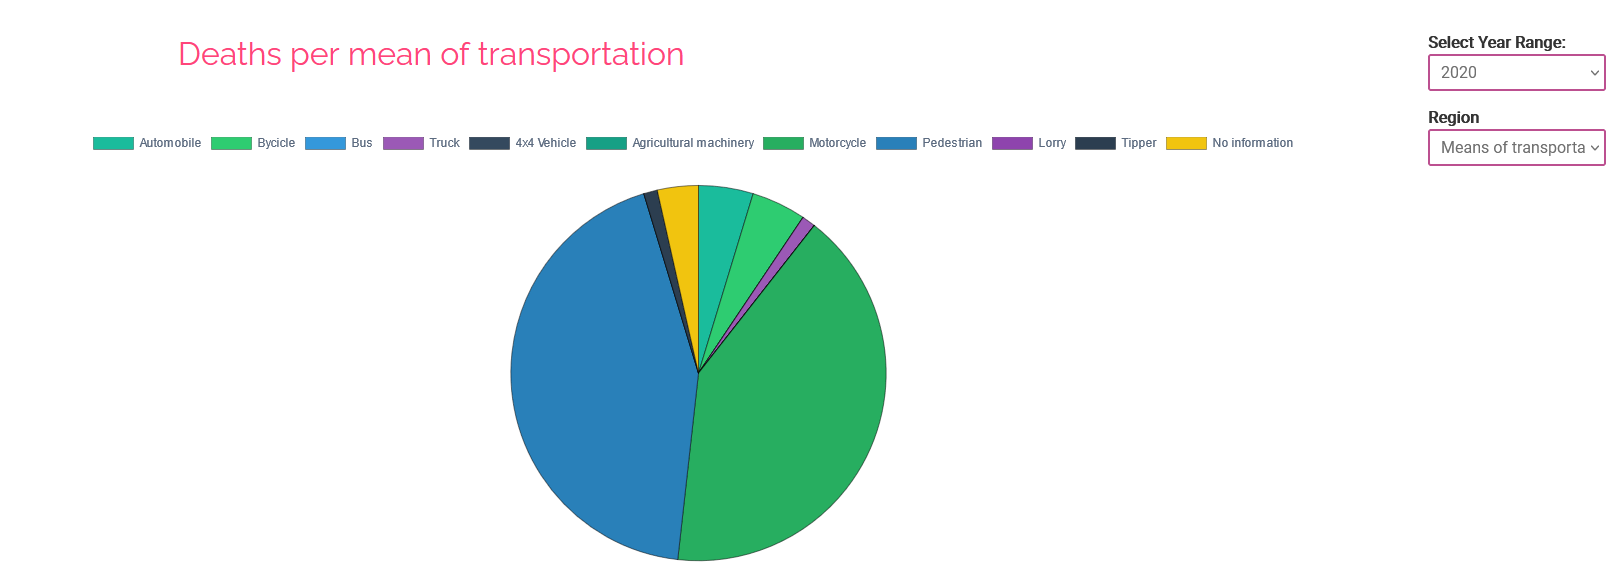
Pie chart
Line chart
This graph type is useful for comprehending the variation in time of one or more categories of an indicator. Moreover, it makes easier to compare among these categories. For example, the following graph illustrates the variation on the number of deaths related to traffic accidents disaggregated by vehicle type:

Line chart
Bar chart
Additionally, the bar chart is useful for comparing the value of an indicator across multiple categories. As the pie chart, you can select the year in which you desire to visualize the data.

Bar chart
Maps
Finally, maps are a visualization type useful for comprehending indicators from a spatial perspective. With maps, we can visualize, for example, the number of inhabitants in each community or area of the municipality, the number of trees, or any other quantitative indicator whose data are disaggregated by geography.

Map